
미국 뉴스 top25로 S&P 500 예측해보기
작품소개
요즘 미국주식이 미쳐 날뛰는 중이다. 전문가들도 예측하기 힘들다는 답변이 대부분이다. 많은 사람들이 전날 뉴스와 같이 필요한 정보를 통해 주가를 예측하고는 한다, 그렇다면 뉴스와 주가와는 관련이 있다고 볼 수 있지 않을까? 에서 시작했다.
News data source: https://www.kaggle.com/aaron7sun/stocknews
환경은 구글의 colab에서 python을 이용해 제작하였다.
데이터
뉴스 데이터는 다음과 같은 형식으로 나타난다.
총 데이터는 2008-08-08 ~ 2016-07-16 까지의 데이터가 있다.
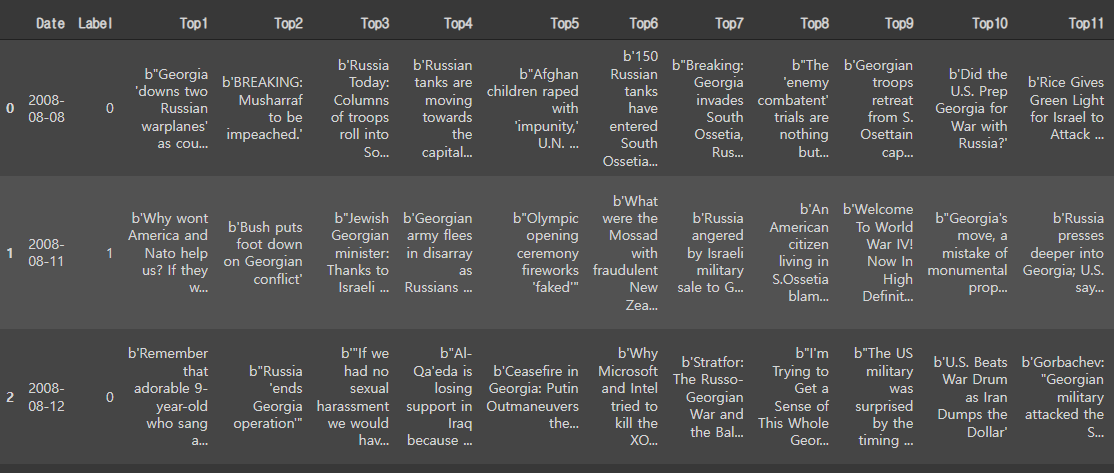
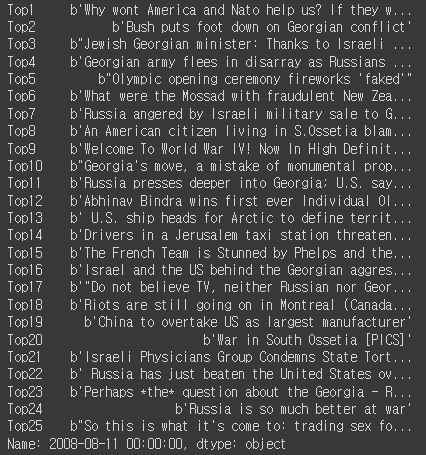
이 중 2008년 08월 11일 뉴스는 다음과 같은 형태로 나타난다.
데이터셋을 확인하면 b’, b’’, \’, \\과 같이 뉴스 데이터와 다르게 나타나는 문자열들이 있어서 이를 제거해준 후 이 중 \\은 it`s와 같이 세미콜론을 표현할 때 사용되어 가장 많이 사용되는 ‘\\s’를 ‘ is’로 변환하였다. 또한 각 문장을 합치고 문장별로 토큰화 시켜준 뒤 다시 그 문장을 단어별로 토큰화 시켰다.
이러한 과정을 통해 문장의 토큰화 후 무작위 날짜의 상위 데이터를 출력하면 다음과 같이 나타난다.
1
2
3
4
5
6
7
8
9
10
11
12
['dalai lama to retire, citing that the tibetan people deserve a freely elected leader.julian assange police investigator a friend of sex assault accuserfrance
recognises rebels as libyan governmentinterrogator in assange case is friends with one of the two women who
reported wikileaks-founder of sexual abusesaudi police open fire at protestlibya: sky news march 8- incredible footage the battle for zawiyah libya (video)police fire on
protesters in saudi arabiafrance becomes first country to recognize libyan rebelssaudi arabian police open fire at rally in the eastern part of the kingdom, which means its
likely lead by shiites and is also directly on top of the vast oil reserves - the worlds largest. interrogator in the assange case friend with woman accusing wikileaks
founderan abandoned and unfinished 45-story skyscraper in caracas, venezuela houses an organized community of roughly 2,500 squatters.dalai lama steps down as tibetan
leader\ncameroon bans twitter in an attempt to stave off opposition protestsnorth korea nears completion of emp bomb, could permanently damage electronics if exploded 25 miles
above ground [fixed link]nerve gas used on yemen protesters palestinian family ordered to share east jerusalem home with israelisprotests and violence spread to saudi arabia;
police open fire on hundreds of protesters with guns and stun grenades in eastern city of qatifreports: saudi police fire at protestersrussia announces ban on arms sales to
libyaguatemala to sue us for intentionally infecting 700 guatemalans with syphilis in the 1940schristians in egypt attacked - 13 deadlibya: nicolas sarkozy to urge targeted
air strikesyemeni army storms university, wounding 98.royal bank of scotland chief executive got 7.7million pay package even though the bailed-out bank lost more than 1billion.
britain demands gaddafi ultimatum after bbc staff tortured in libya']
코드
1
2
3
4
5
6
7
8
9
10
11
12
13
14
15
16
17
18
19
20
21
22
23
24
25
26
27
28
29
30
31
32
33
34
35
36
37
38
39
40
41
42
43
44
45
46
47
48
49
50
51
52
53
54
55
56
57
58
59
60
61
62
63
64
65
66
67
68
69
70
71
72
73
74
75
76
77
78
79
80
81
82
83
84
85
86
87
88
89
90
91
92
93
94
95
96
97
98
99
100
101
102
103
104
105
106
107
108
109
110
111
112
113
114
115
116
117
118
119
120
121
122
123
124
125
126
127
128
129
130
131
132
133
134
135
136
137
! wget http://nlp.stanford.edu/data/glove.6B.zip #스탠포드에서 제공하는 임베딩 벡터
! unzip glove*.zip
import re
import os
import pandas as pd
import numpy as np
import matplotlib.pyplot as plt
from sklearn.model_selection import train_test_split
from sklearn.metrics import classification_report
from tensorflow.keras.preprocessing.text import Tokenizer
from tensorflow.keras.preprocessing.sequence import pad_sequences
from tensorflow.keras.utils import to_categorical
from tensorflow.keras.models import Model
from tensorflow.keras.layers import Embedding, Dropout, Conv1D, GlobalMaxPooling1D, Dense, Input, Flatten, Concatenate
from google.colab import drive
drive.mount('/content/drive') #colab을 사용했기에 구글드라이브에 마운트하여 파일을 가져왔다.
Combined_News_DJIA = '/content/drive/MyDrive/Combined_News_DJIA.csv' #kaggle에서 받은 데이터 경로
df0 = pd.read_csv(Combined_News_DJIA)
df0.index=pd.to_datetime(df0['Date'])
del df0['Date']
headlines = []
clean_headlines=[]
clean_lower_headlines=[]
for row in range(0, len(df0.index)): row=0,1,2,.....len(df2.index)
headlines.append(''.join( str(x) for x in df0.iloc[row, 1:26]))
for i in range(0, len(headlines)):
clean_headlines.append(re.sub("b[(')]", '', headlines[i]))
clean_headlines[i]= re.sub('b[(")]', '', clean_headlines[i])
clean_headlines[i]= re.sub("\'", '', clean_headlines[i])
clean_headlines[i]= clean_headlines[i].replace("\\"," i")
for i in clean_headlines:
clean_lower_headlines.append(i.lower())
df0['combined_news']=clean_lower_headlines
X = np.array(df0[['combined_news']])
y = np.array(df0['Label'])
X_train, X_test, y_train, y_test = train_test_split(X, y, test_size=0.1,random_state=0)
#훈련용 문장 수 1790, 레이블도 1790, 테스트용 199
tokenizer = Tokenizer()
tokenizer.fit_on_texts(X_train.ravel())
sequences = tokenizer.texts_to_sequences(X_train.ravel())
word_index = tokenizer.word_index
vocab_size = len(word_index) + 1
#단어 집합 최대 크기:56443, 문장의 최대 길이: 679
plt.hist([len(s) for s in sequences], bins=50)
plt.xlabel('length of samples')
plt.ylabel('number of samples')
plt.show()
max_len = 679
intent_train = pad_sequences(sequences, maxlen = max_len)
label_train = to_categorical(np.asarray(label_train))
#전체 데이터의 크기(shape): (1790, 679) 레이블 데이터의 크기(shape): (1790, 2)
indices = np.arange(X_train.shape[0])
np.random.shuffle(indices)
print(indices)
X_train = intent_train[indices]
y_train = label_train[indices]
embedding_dict = dict()
f = open(os.path.join('glove.6B.100d.txt'), encoding='utf-8')
for line in f:
word_vector = line.split()
word = word_vector[0]
word_vector_arr = np.asarray(word_vector[1:], dtype='float32') # 100개의 값을 가지는 array로 변환
embedding_dict[word] = word_vector_arr
f.close()
embedding_dim = 100
embedding_matrix = np.zeros((vocab_size, embedding_dim))
for word, i in word_index.items():
embedding_vector = embedding_dict.get(word)
if embedding_vector is not None:
embedding_matrix[i] = embedding_vector
kernel_sizes = [2, 3, 5]
num_filters = 512
dropout_ratio = 0.5
model_input = Input(shape=(max_len,))
output = Embedding(vocab_size, embedding_dim, weights=[embedding_matrix],
input_length=max_len, trainable=False)(model_input)
conv_blocks = []
for size in kernel_sizes:
conv = Conv1D(filters=num_filters, kernel_size=size, padding="valid", activation="relu", strides=1)(output)
conv = GlobalMaxPooling1D()(conv)
conv_blocks.append(conv)
output = Concatenate()(conv_blocks) if len(conv_blocks) > 1 else conv_blocks[0]
output = Dropout(dropout_ratio)(output)
model_output = Dense(2 , activation='softmax')(output)
model = Model(model_input, model_output)
model.compile(loss='categorical_crossentropy', optimizer='adam', metrics=['acc'])
model.summary()
history = model.fit(X_train, y_train, batch_size=64, epochs=10, validation_split=0.2)
epochs = range(1, len(history.history['acc']) + 1)
plt.plot(epochs, history.history['acc'])
plt.plot(epochs, history.history['val_acc'])
plt.title('model accuracy')
plt.ylabel('accuracy')
plt.xlabel('epochs')
plt.legend(['train', 'test'], loc='lower right')
plt.show()
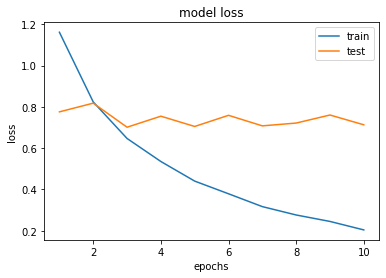
epochs = range(1, len(history.history['loss']) + 1)
plt.plot(epochs, history.history['loss'])
plt.plot(epochs, history.history['val_loss'])
plt.title('model loss')
plt.ylabel('loss')
plt.xlabel('epochs')
plt.legend(['train', 'test'], loc='upper right')
plt.show()
X_test = tokenizer.texts_to_sequences(X_test.ravel())
X_test = pad_sequences(X_test, maxlen=max_len)
y_predicted = model.predict(X_test)
print('accuracy: ', sum(y_predicted == y_test) / len(y_test))
print("Precision, Recall and F1-Score:\n\n", classification_report(y_test, y_predicted))
1
2
3
4
5
6
7
8
9
10
11
accuracy:  0.46733668341708545
Precision, Recall and F1-Score:

               precision    recall  f1-score   support

           0       0.48      0.21      0.29       104
           1       0.46      0.75      0.57        95

    accuracy                           0.47       199
   macro avg       0.47      0.48      0.43       199
weighted avg       0.47      0.47      0.43       199
감성분석(?)
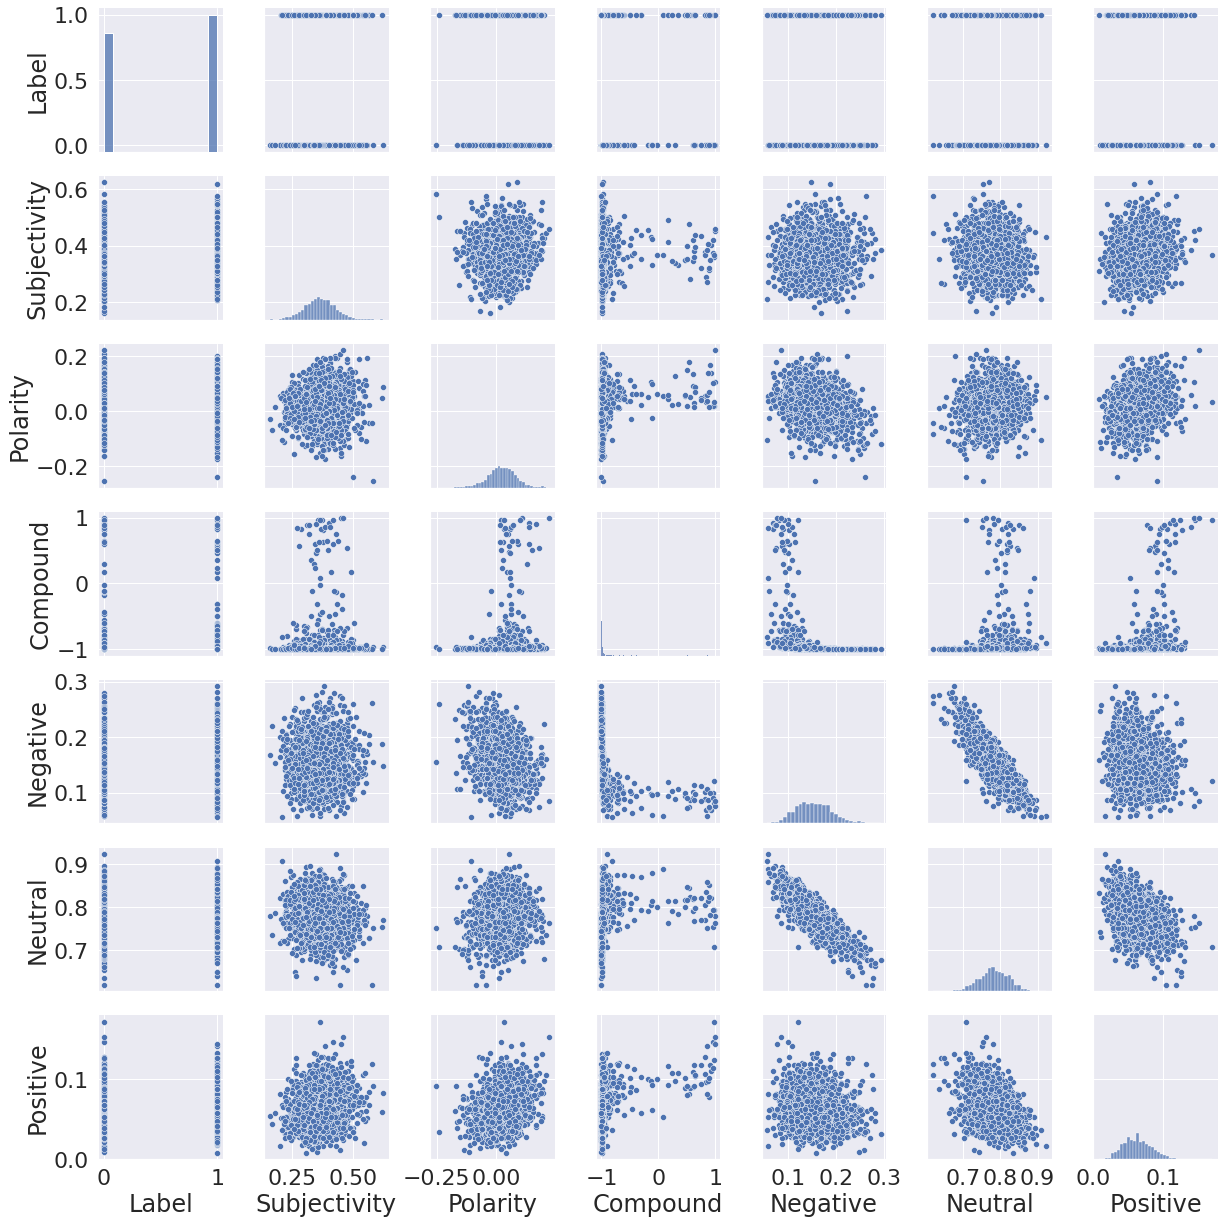
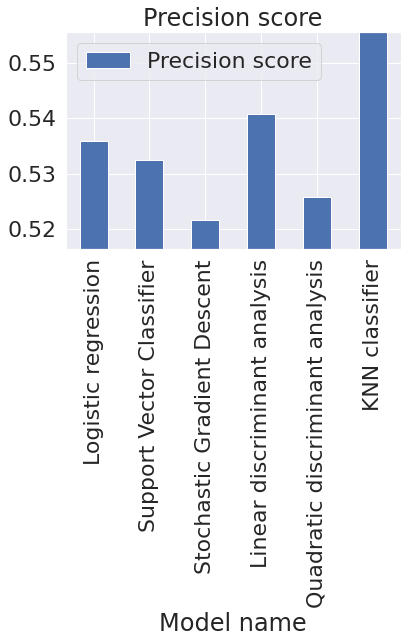
앞서 1dconv를 통해서는 찍는 것과 비슷한 결과를 얻을 수 있었고 vaderSentiment와 textblob을 사용하여 텍스트에 대한 감성분석을 하고 이를 기반으로 선형판별분석, Logistic regression, Support Vector Classifier, Stochastic Gradient Descent, Quadratic discriminant anlaysis, KNN classifier를 이용해 한 결과는 0.48~0.52 수준으로 결국 큰 성과는 얻지 못했다. 하지만 이 결과는 모든 피쳐값(Subjectivity, Polarity, Compound, Negative, Neutral, Positive)를 모두 사용해서 이러한 결과가 나온 것 같다. 실제적으로 관련성을 보인 피쳐값은 Neutral과 Negative 정도가 선형성을 보이고 compound 값의 첨도가 큰 것 외에는 큰 의미를 담고 있지 않는 것처럼 보였다. 그렇기에 feature engineering을 통해 정보를 가공한 후에는 보다 더 나은 정보를 얻을 수 있을 것이다.
결과 및 느낀점
유진 파마의 효율적 시장 가설에 따르면 시장은 얻을 수 있는 모든 정보를 빠르게 반영하여 그 정보들을 이용하여 장기적으로 시장 수익률을 넘을 수 없다는 가설이 있다. 하지만 실제로는 시장이 효율적으로만 돌아가는 것이 아니기에 많은 사람들이 이 가설을 넘기 위해 노력했다. 이렇게 뉴스라는 텍스트를 통해 주가를 예측하는 것 또한 같은 취지에서 나온 것이다. 장기적으로는 넘을 수 없더라도 +alpha가 있다면 단기간, 단기간에는 넘어 결국 장기적으로 시장 수익률을 넘는 것이 많은 사람이 꿈꾸는 일이다.
다음에는
feature를 조절하는, 혹은 내가 새로운 모델을 학습하는 방향을 통해 +alpha를 찾아보고 싶다. 또한CNN을 처음에 생각한 이유가 결국 뉴스 데이터들간의 관계가 있지 않을까? 라는 가설을 세우고 접근한 것인데 단순히 텍스트를 대치한 것으로는 큰 정보를 얻을 수 없었다. 텍스트를 전처리 하는 방법, 예를 들어 특정 주식의 키워드가 들어간 뉴스에만 적용한다던가 하는 등의 행동을 통해서 특정 주식의 가격은 어느정도 예측해볼 수 있을 것이라 생각한다.- 이번 전시를 통해
CNN의 기본 구조, 머신러닝이란 무엇인지에 대해 혼자 학습해볼 수 있는 기회를 가질 수 있었으며 배움이 많이 부족함을 느끼고 후에 공부해야 할 방향을 잡을 수 있던 것 같다. - 감사합니다.